Finding the First Thread with a Visualization

Finding the first thread to pull to get an investigation started can sometimes be difficult. Having a checklist and a structured approach to your investigation can help quite a bit. Experience also can help you come up with a list of artifacts to review and places to check, but what if it is an unfamiliar scenario? Either because you are new to DFIR or the particular case is different than anything you've come across before. Where do you start?
I wrote previously about visualizing the USN Journal as a way to get an overview of what happened on a system. This type of visualization also can be used as a way to kick off the investigation. You can use it to help you get started by highlighting artifacts on disk that could use a closer look.
Visualizing a Challenge
@binaryz0ne put out a forensic challenge a while ago and Jared Greenhill (@jared703) did a nice and detailed write-up of his process in answering the questions posed in the challenge. I'm not going to do another write-up (Jared did an excellent job), but rather take a different approach and use a USN journal visualization to see if any "threads" stand out to start tugging on.
I followed the steps in my prior post to create the visualization; I'll summarize them here, but won't go into detail:
- Extract the $USN:$J, $LogFile, and $MFT
- Process with Triforce ANJP
- Convert the Triforce SQLite database to a gource-formatted log file*
- Point gource at the log file and watch the show
*I actually first took a peek at the USN data in Triforce and identified two files (ServerManager.log and setupapi.dev.log) that together made up about 90% of the entries. I noted them down for a look later and modified the conversion SQL to exclude them to make the visualization cleaner.
Here is the resulting visualization. You will occasionally see a popup over a dot listing the file path - that was me mousing over various items that looked interesting. If you run a visualization like this yourself, you can pan, zoom, hover, and jump forward/backward, which can be helpful when a lot of events happen rapidly. Below the video is a list of "threads" that I noticed and wrote down while watching it. If I was starting an investigation, I would take a closer look at each one and see where they take me.
Observations ("Threads")
Random-looking named .php files in xampp/htdocs created and deleted
- CBS.log repeatedly written to - not sure what this is, but worth a look
- Multiple files accessed under xampp/mysql/data/dvwa - probably should check out this directory
- Lots of session-related files (guessing from name sess_*) under xampp/tmp; might be worth a look to see if anything interesting is there
- Activity under Administrator's "Temporary Internet Files" folder, including a file named with an RFC1918 IP and "xss_s[2].html. Definitely check out the Internet Explorer history
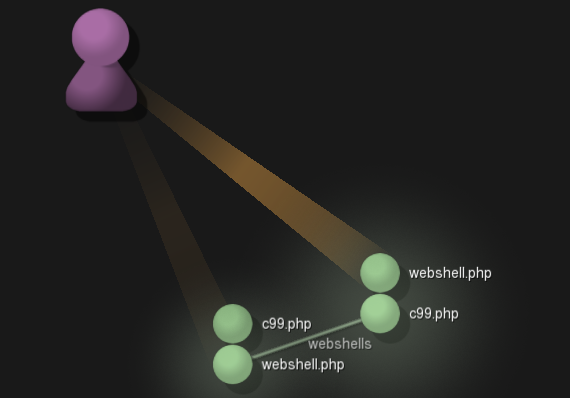
- See a "htdocs/DVWA/hackable/uploads" directory with "phpshell.php" - looks like badness. Then see webshells.zip, c99.php, and webshell.php being created... not good.
- xampp/php/logs/php_error_log activity after the PHP webshell uploads - may be something interesting there
- hackable/uploads - "abc" directory created
- Lots of activity involving the SAM, SYSTEM, SOFTWARE - better check the Registry
- Also seeing winevt/Logs being written - System.evtx, Security.evtx, Microsoft-Windows-GroupPolicy%4Operational.evtx - looks like some event log review is in my future
- Administrator's UsrClass.dat touched - Shellbags?
- Seeing more c99.php files created and deleted under Users/Administrator/AppData/Local/Temp
All this in the first two and a half minutes of the video! If you were spinning your wheels not knowing where to start, you now have a whole list of things to run down. Some of the things I noticed will pan out and others won't; that's how investigations go.
I'm not going to take this particular investigation any further; the point was to demonstrate another use for visualizations and the USN journal. If you are interested, I'd encourage you to try the challenge out yourself and see what you find (and then read Jared's write-up).
Good hunting!