Visualizing USN Journal Activity

Since learning about the USN journal, my investigative process has never been the same. It is a powerful artifact that can tell us much about what has transpired on a system. However, the wealth of data that the USN journal brings to an investigation can be a double-edged sword: the vast quantity of information can be daunting and hard to sift through. The event signatures offered as part of ANJP Triforce are one way to help home in on relevant artifacts, as is filtering down to narrow date ranges. Another way is to use the USN journal as a source of context; I often find myself jumping back to the USN every time I find something interesting from a different artifact to see if it can show me any surrounding events.
While both those methods work well, I've long been thinking about a way to more easily get a high-level view of USN journal activity. One day it clicked in my head to just think of the USN journal as another log file, rather than something specific to an NTFS file system. This opened up my search to a whole host of previously developed open source log visualization software. One tool in this category is Gource, a tool to visualize version control repositories. I've found that by using Gource, ANJP Triforce, and some SQL, I am able to create visualizations of USN activity worthy of CSI:Cyber.
Preparing the Data
Gource has the ability to parse a custom log format, but I think "generic" is a better description than "custom", as the data needs to be in a specific format, not something that can be specified by the user. My first step was to transform the USN data into a format that Gource can understand. Gource expects the log to be in the following format:
timestamp|username|update_type|file_path|color (optional)
I mostly use ANJP Triforce to process the USN, and that tool conveniently saves the processed data in a SQLite database. I crafted the following SQL query to transform the Triforce data into a text file in the Gource custom log format:
/* SQL to convert a Triforce ANJP USN Journal database to a Gource custom log
     by ryan@obsidianfornesics.com
Convert the human-friendly timestamp to epoch seconds:   */
SELECT CAST(round((JULIANDAY(ur_datetime)-2440587.5)*86400,0) as integer),
  'USN', -- gource needs a 'User', so I set it statically to 'USN'
  CASE ur_reason_s  -- gource supports three file 'update types':
    WHEN 'File_Create' THEN 'A'       -- 'A' for adding a file
    WHEN 'File_Delete,Close' THEN 'D' -- 'D' for deleting
    ELSE 'M'                          -- and 'M' for modifying
  END,
REPLACE(ure_fullname, '\', '/') -- swap the backslashes for forward slashes
FROM usn_journal_report         -- this is a view in the Triforce ANJP DB
ORDER BY ur_datetime ASC;       -- order by timestamp
Gource only supports three file update types, while the USN Journal has many more than that. I decided that mapping 'File_Create' to 'Add', 'File_Delete,Close' to 'Delete', and then all other USN actions to 'Modify' works fairly well. Gource needs a Unix-style timestamp, so the first line of the query converts something like '2015-05-23 12:34:56' to '1432409696'. It also only supports full seconds, so we lose some precision with the conversion.
After processing the $USN:$J, $LogFile, and $MFT with Triforce ANJP (either the free or paid versions of Triforce work), you can use the free command line tool sqlite3.exe and the above SQL query (saved as USN_to_Gource.sql) to create a Gource custom log file from a Triforce database like this:
> sqlite3.exe usn.db < USN_to_Gource.sql > usn.log
Let's break this command down. First, we're telling sqlite3.exe to open usn.db. Next, the < sign directs sqlite3.exe to run the query saved in USN_to_Gource.sql. Lastly, > redirects the output of the query to usn.log. Below is a snippet from usn.log:
1424658814|USN|M|/Users/user1/AppData/Local/Temp/logEF94.txt
1424658814|USN|A|/Users/user1/AppData/Local/Temp/testmem.exe
1424658814|USN|M|/Users/user1/AppData/Local/Temp/testmem.exe
1424658814|USN|M|/Users/user1/AppData/Local/Temp/testmem.exe
1424658814|USN|D|/Users/user1/Downloads/voice#5734223/voice.exe
1424658814|USN|A|/Windows/Prefetch/VOICE.EXE-78467D55.pf
Creating the Visualization
Now that we've converted the USN data, we can do the fun part: creating a visualization. Gource has a number of command line switches that you can tweak to your heart's content, but this is the minimum to get started:
> gource.exe --log-format custom C:\path\to\usn.log
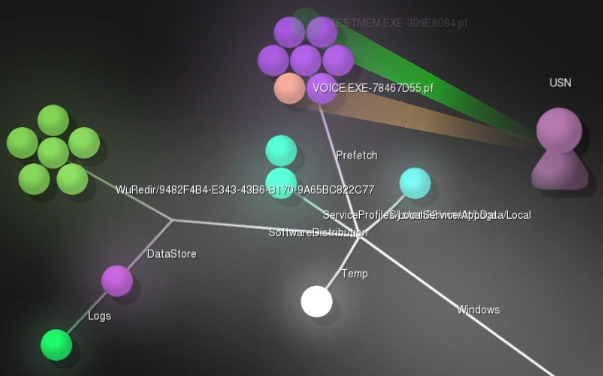
This will launch a video of a little 'USN' figure zapping dots. Each dot represents a file, and each 'zap' is an action (file creation, modification, or deletion). The default playback speed on the video is 1 day in 10 seconds, which is fine for VCS repos, but gets out of hand when visualizing USN journals with hundreds of events per minute. I'd recommend changing the playback to real-time or even slower. If you have an idea of the timeframe of interest, trimming the visualization down to a smaller time period can also be helpful.
Some helpful command line options are:
- --realtime (slows playback to real-time)
- -s 170000 (slows playback down to around half-speed)
- --highlight-dirs (makes directories more readable)
- --start-date and --stop-date (helps with big journals)
Examples
Mari DeGrazia wrote an excellent post a few months ago on examining the USN journal to determine what actions a piece of malware had taken on a victim system. She was kind enough to share her test data with me, and I've made a visualization from it. I've used the start and end date flags to trim the Gource video down to the ~90 seconds when the malware activity mentioned in Mari's post takes place and set the speed to real-time. You can see the malware executable being created and deleted in the video, as well as the prefetch files and other system files. I'd recommend reading her post and then reviewing the visualization to see what else you can recognize.
The next example is of a system where everyone's favorite "system optimization" / anti-forensics tool, CCleaner, has been run. As it begins you can see the CCleaner files being created in the bottom-left as the application is installed, then the explosion of temporary "ZZZZ"-type files being created and deleted as it runs. I think the visualization nicely illustrates the many transient files that can appear in the USN journal.
The last example demonstrates how one might use the USN journal in a case where user-created documents are a primary concern. I've modified the SQL query given above by adding WHERE ure_fullname LIKE '%.docx' to only show newer-format Word documents. An approach like this may be helpful to quickly see what information about document creation, modification, or deletion is contained in the USN journal. This particular dataset is from a secondary drive on my own system that I use for document storage. Because it is not an operating system drive and I use it sporadically, the USN journal goes back about three months, rather than a handful of days. The content of the visualization is not particularly exciting (just me working on homework assignments), but it demonstrates the idea. This visualization runs at a much higher speed than the others (-s 5, or 5 seconds/day), since it covers a much longer time period. You can see the documents being created, then modified repeatedly as I work on them.
Conclusion
Visualization is just one more technique we can use to look at the USN journal. It certainly doesn't remove the need to examine critical areas of the USN line-by-line to thoroughly understand what has transpired, but I think it can aid our analysis. Because of the ease and speed with which the SQL query can be modified and the Gource log regenerated, the visualization can be used iteratively. The examiner can review it, make changes, and rebuild it as new things come to light.
The visual and animated nature of the output also can allow us to recognize patterns and relationships between files in new ways. I believe the use of visualizations in digital forensics will increase in the future, especially as our datasets continue to grow. Methods to quickly extract trends and outliers will become essential as drive sizes increase and the number of devices we need to examine grows. Visualizations also can be helpful when you need to explain some activity to a less technical audience.
The USN journal is a powerful artifact and I hope this visualization technique helps you make better use of it.
Links
Gource [https://github.com/acaudwell/Gource]
sqlite3.exe [https://www.sqlite.org/download.html]
Triforce ANJP [https://www.gettriforce.com/product/triforce-anjp/]
USN_to_Gource.sql [https://gist.github.com/obsidianforensics/d075d1f78df23b23a48d]