Visualizing Activity from Metadata

Encrypted iPhone backup? That means it's useless to an investigator (or attacker), right? Not so fast. We can still get an incredible amount of insight into the actions on the devices from the metadata alone.
I am currently taking Sarah Edward's FOR518: Mac Forensic Analysis from SANS. It covers both macOS/OS X and iOS artifacts and I've really enjoyed the class so far. If you've never taken a SANS class before, the general structure is to have a block of lecture followed by an exercise on that topic so the students can use that knowledge and really burn it in.
After we finished a section on iOS acquisitions and backups, we had an exercise with multiple parts. In one segment, we were given an encrypted iOS backup and asked questions about it: what day was it likely that a user installed a particular application, what is the username or user ID for a different application, and so on. We weren't doing any password cracking or otherwise trying to get access to the encrypted backup files, because we didn't need to: we could answer all these questions solely using metadata (which is not encrypted pre-iOS 10).
If you haven't looked at the files that make up an iOS backup, the majority are named with the SHA1 hash of their location on the iOS device. These are the individual files from the backup, and if the backup was encrypted, each file will be encrypted. If the backup isn't encrypted, you could open those files in your viewer of choice, even though the file names are mangled. However, even in the encrypted case there are still a few non-encrypted files that contain metadata about the backup: Info.plist, Status.plist, Manifest.plist, and Manifest.mbdb. That last file is a proprietary database that holds the metadata for each of the content files in the backup. This metadata includes file name, path, size, and MAC timestamps (among other things). Hal Pomeranz wrote a script called mbdbls.py that parses this database out into a nice, easy to read format:
drwxr-xr-x   501   501       0 2016-07-12 18:08:11  2016-07-12 18:08:11  2014-12-03 19:20:45  cd9065c1e4b785cee8a0d9e6c90275f5e837c4d7 AppDomain-com.apple.iBooks::Library
drwxr-xr-x   501   501       0 2016-07-12 18:08:15  2016-07-12 18:08:15  2014-12-03 19:20:45  83eeb46d85472b89b8390d341bb0c896e53502b6 AppDomain-com.apple.iBooks::Library/Preferences
-rw-------   501   501     809 2016-07-12 18:08:15  2016-07-12 18:08:15  2016-07-12 18:08:13  51fca3a3004e8f8e08f37a0a5ac3d7512274ee24 AppDomain-com.apple.iBooks::Library/Preferences/com.apple.iBooks.plist
drwxr-xr-x   501   501       0 2016-07-12 18:08:11  2016-07-12 18:08:11  2016-07-12 18:08:11  d95fdd7d874991aec0b9260223f60d6c008474a6 AppDomain-com.apple.iBooks::Library/com.apple.iTunesStore
drwxr-xr-x   501   501       0 2016-07-12 18:08:11  2016-07-12 18:08:11  2016-07-12 18:08:11  25ca8b1106dd22d83351aef67278200618f087e4 AppDomain-com.apple.iBooks::Library/com.apple.iTunesStore/LocalStorage
Transforming the Metadata
While working my way through the exercise, I remembered a couple blog posts I had written a while ago about visualizing USN journal activity. You can read the posts for the full details, but the short version is there is a visualization tool called Gource that is designed to show version control system activity (like git commits) as little figures flying around zapping files. I massaged the USN journal output into Gource format and made a "shiny" visualization that is actually pretty good for getting an overview of what was going on in the USN journal.
It occurred to me that it might be interesting to do something similar with the backup metadata. I modified Hal's script (and sent a PR on GitHub) to add another output option (-g for Gource) which formats the output into Gource's custom log format. Since we don't have as detailed information as in the USN journal on what type of operation is taking place, I just set all the operations as file modifications (M). I also made the output a set, so each timestamp/file path tuple only appears once. Here is the command to parse a Manifest.mbdb file with the new output flag and a snippet of the output:
> python mbdbls.py -f Manifest.mbdb -g

1417729597|User|M|/Media/PhotoData/Thumbnails/V2/DCIM/100APPLE/IMG_0008.JPG/5003.JPG
1417732840|User|M|/Media/DCIM/100APPLE/IMG_0009.JPG
1417732841|User|M|/Media/DCIM/100APPLE/IMG_0009.JPG
1417732841|User|M|/Media/PhotoData/Thumbnails/V2/DCIM/100APPLE/IMG_0009.JPG
1417732841|User|M|/Media/PhotoData/Thumbnails/V2/DCIM/100APPLE/IMG_0009.JPG/5003.JPG
1417743015|User|M|/Media/DCIM/100APPLE/IMG_0010.JPG
1417743015|User|M|/Media/PhotoData/Thumbnails/V2/DCIM/100APPLE/IMG_0010.JPG
1417743015|User|M|/Media/PhotoData/Thumbnails/V2/DCIM/100APPLE/IMG_0010.JPG/5003.JPG
1417747298|User|M|/Library/Preferences/com.apple.mediaartworkd.plist
Visualizing Activity
Now let's get this data into Gource and start visualizing activity. Since I am in a Mac forensics class, we'll do this one on macOS. If you have homebrew, Gource is simple to get working: brew install gource. You could save off the output of the Python script to a file and then run Gource on that, but I opted to just pipe the output directly to Gource since the Python script runs so quickly. The command I'll use is:
> python mbdbls.py -f Manifest.mbdb -g | gource --log-format custom -s 1 --highlight-dirs --key --auto-skip-seconds 1 -
What this one-liner does is:
- Run mbdbls.py to parse our Manifest.mbdb file, with output in Gource format
- Send that output to Gource
- Use the custom log format (--log-format custom)
- Make each day in the log take one second (-s 1)
- Make the directory names more readable (--highlight-dirs)
- Show a legend on the side with the counts of each file extension (--key)
- Skip ahead in log time if there are gaps of more than a second (--auto-skip-seconds 1)
- Expect input to be piped in (-)
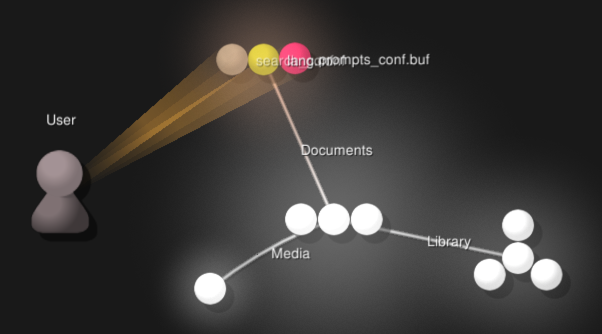
Here's what that one-liner gets you:
The output is a bit slow at the beginning, but then starts to explode with activity. It can be hard to read at times in the video, but when you run the visualization yourself you can pause, pan, zoom, and highlight items by hovering on them. Gource has many more command line options that you can use to tweak the output to look exactly as you want it to. You also could filter out some of the file activity by inserting a grep command in between the Python script and Gource. Here's an example to just see .sqlite files:
python mbdbls.py -f Manifest.mbdb -g | grep .sqlite | gource --log-format custom -s 1 --highlight-dirs --key --auto-skip-seconds 1 -
Like with the USN journal visualization, you will still want to go look line-by-line at certain files as a follow up, but the visualization should be a good place to start.
Conclusions
You can tell quite a few high level things about what the user is doing by visualizing activity: seeing photos appear under DCIM, watching an explosion of files being created or touched under various app directories, and LocalStorage databases popping up as the user accesses websites. Another takeaway from this is to underscore the importance of metadata. You can often figure out an incredible amount of information about activities by looking solely at metadata. In an age where more and more systems are moving to higher levels of encryption, as investigators we may only get access to metadata rather than the actual contents, whether that be phone calls, web traffic, file system activity, or phone backups.
Don't let the fact that you don't have all the information stymie your progress. Sometimes in investigations we need to get a bit creative and work with what we do have, rather than what we wished we had.