Capturing Chrome's Evolution

When I was pretty fresh in the field of digital forensics, I picked this new thing called Google Chrome to dig into. There weren't a lot of tools out there that could parse it and I thought learning about browser history would be a useful skill for me. I started work on my first open source tool, called Hindsight, and learned a lot about coding along the way. I think that's worked out quite well for me 😃.
As part of keeping Hindsight up to date, I started documenting the database structures for each version of Chrome as it was released, since even a small change in the schema of a database could cause Hindsight (or any tool) to break or potentially miss important information. I talked a little about my process the first time I was on the Forensic Lunch and I released a chart showing how Chrome databases have changed over time. As part of this process, I needed sample data from every version of Chrome. So I made some!
Generating "user data" for every Chrome version
I wanted a data set consisting of the same "user actions" done in each version of Chrome. I wanted any differences in the collected data to be because of Chrome behaving differently in a new version, not because of the user (me) doing different actions.
To generate this data, for each version of the browser I would:
- Download the current (at the time) Chrome installer.
- Start up a mostly-fresh Windows VM (it was Windows 7 at first, then Windows 10) and install Chrome.
- Perform a standard "script" of browsing actions (make some Google searches, start new tabs, visit popular websites and do common actions on them, etc) as consistently as I could. I was doing the browsing manually, so it wasn't perfect, but my goal was to have each browsing session consist of the same user actions, so I would (hopefully) generate similar browser artifacts.
- Shut down Chrome and make a logical evidence file of the Chrome profile directory.
- Run some scripts I've built across all the collected Chrome profiles, highlighting any differences.
I've been following this tradition roughly every six weeks for about the past six years. I've found the resulting data extremely helpful. I've used it discover many changes in Chrome (including removed artifacts, renamed database columns, and new storage technologies). I've used what I learned to deepen my understanding of how web browsers work, get ideas for new research projects and conference presentations, and keep Hindsight working on all Chrome versions. I think Chrome's roughly six week release cycle is nice too: just enough time between versions for me to be ready to dive in again and see what's new.
New Version of Chrome Evolution Visualization
I really liked the database evolution chart and wanted to keep it going, but the format it was in made it very difficult to update. The last version of the chart covered through Chrome 35 and it was already getting pretty crowded. We're at version 72 now, so I definitely needed a different approach for displaying the data. I'm a big fan of visualizations and I've been toying with different ideas for a while.
A goal I had for this next version was to expand to capture more than just the changes in Chrome's SQLite databases. The whole structure of the Chrome profile has been evolving, with different storage formats supplanting older ones, new types of data being recorded, and just generally growing in size.
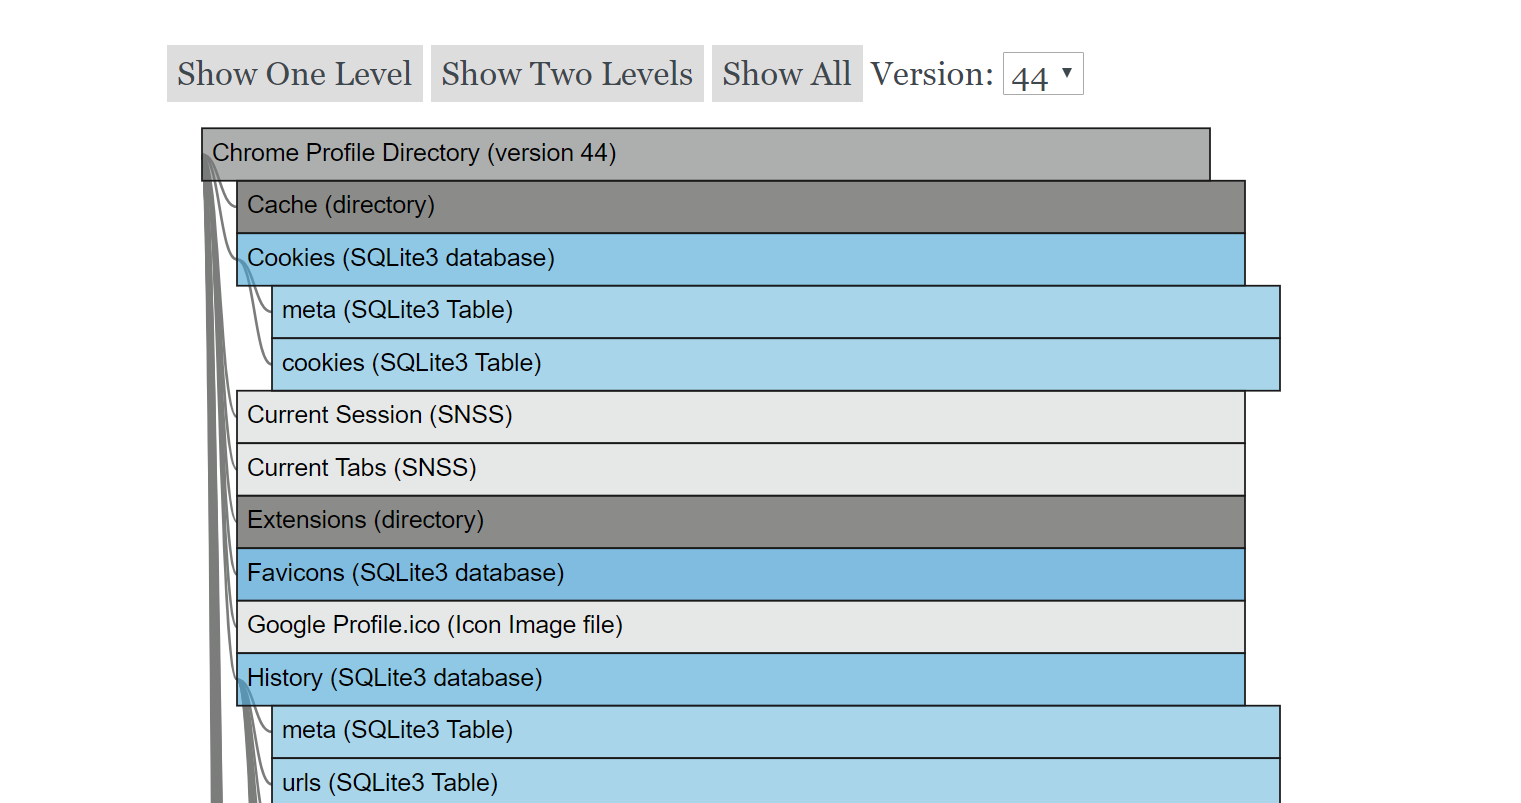
I settled on using a collapsible indented tree to show all the files and directories that make up each Chrome profile. You can play with it at dfir.blog/chrome-evolution (preview below):
The tool has a "tree" for each Chrome version and you can switch to a different version using the drop-down at the top. There are also some buttons to quickly expand the tree to different levels: one, two, and all. I found the two-level view a good balance, so that's the default view when you switch versions.
I think the collapsible part of the graphic is key, simply due to the number of files in each profile. The number of top-level items in the profile directory has grown three-fold from version 1 to 72, and the total number of items has grown by a larger factor than that.
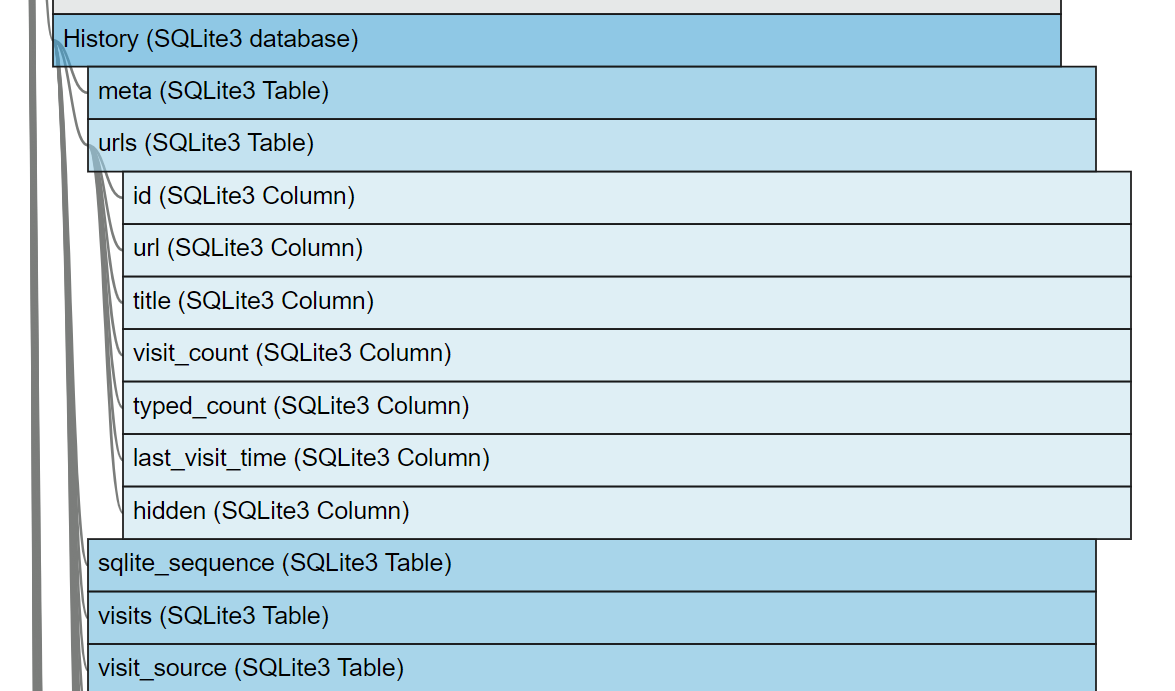
Just because I moved to tracking things at the file and directory level, I didn't want to lose the ability to explore how the tables and columns inside the SQLite databases change. I gave the databases special treatment: you can click and expand them to see the tables they contain, then click again to expand a table to see its columns.
The collapsible part of the tree is nice, but there are some cases where it didn't help: single directories with thousands of files. Since that pretty well describes cache directories, I did some pruning to cut out files that (in my opinion) just add to the size of the tree without adding much value. In any instances where I cut out items, I inserted a placeholder rectangle in yellow describing the removal.
Future Updates
I plan to keep updating this tool, at a minimum with the new versions of Chrome as they are released, but I have lots of other ideas I'd like to implement as well. One shortcoming of the browsing "script" I follow when generating the data for each profile was its size. It generally took me about 5 minutes to perform the set of actions, so the resulting profile is smaller than what you'd typically encounter in the real-world. I tried to hit as many actions types as possible, but I've found I missed some (and I can't change the script, since that would nullify one of my main objectives: consistency). I have some ideas around a larger "browsing sample" that would make a larger Chrome profile, and thus more types of artifacts. I also have some ideas on showing how specific artifacts change over time.
I hope you find this visualization useful (or at least interesting!). You can find me on Twitter if you want to share any ideas or observations.